
Find out where error in species location impacts distribution models?
In developing species distribution models (SDMs), problem of positional error (or uncertainty) in species occurrence location becomes important when these data are used to develop the SDM. Coordinates are used to extract the co-located environmental variables and thus, positional error will transfer to inaccurate characterizations of the species-environment relationship.
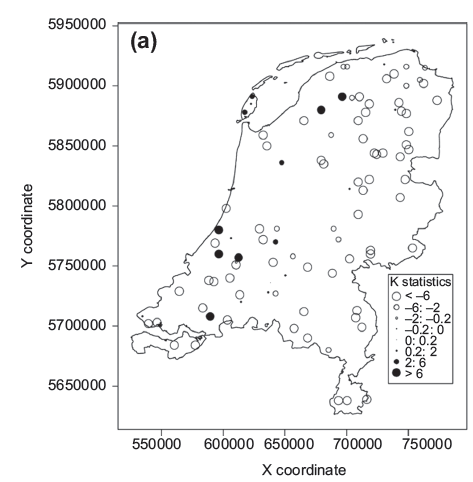
In this text, which is based on Naimi et al. (2013), a tool (an R package we developed) is demonstrated which can be used to target the locations that are likely to deline the performance of SDMs. Following you can see a map as an example to show how the tool works (species occurrence locations with higher values, filled circles, are likely to cause a problem in the output):
This work is relevant to the previous study (Naimi et al. 2011) where we proposed to examine (global) spatial autocorrelation in predictors to understand if there is a risk that the SDM is affected by positional uncertainty in the species data (see here to find out how to do the procedure).
Here, we extend the previous study by employing local spatial autocorrelation measures. For this purpose, using local indicators of land association (LISA) may be more insightful because it may lead to identification of the specific occurrence records that cause the largest drop in SDM performance.
To know more on the approach and the tests take a look at the origical article (Naimi et al., 2013):
Through this study, an R function has been developed and was included to the usdm (uncertainty analysis for SDMs) package. The function (speciesLisa), calculates a local indicator of spatial association, named K statistic (and, optionally, other local indicators of spatial associations) in predictors at each sample location. Given species sample locations, an estimate of the positional uncertainty, as well as a set of predictors and their importance, this function returns an object of a class of “speciesLISA” including K statistic (or other LISAs) for each predictor at each sample location and an aggregated K statistic. plot function maps the results which allows us to target the locations that are likely to affect the predictions from the SDMs. usdm also includes some other functions related to the purpose of the package.
Following, you will see an example based on the data provided by the usdm package:
#To install the packge:
install.packages('usdm')
#The following commands demonstrate the calculation of the K statistics for a sample dataset in the Netherlands (case study of nl1):
library(usdm)
# reading predictor variables:
file <- system.file("external/predictors.grd", package="usdm")
predictors<-brick(file)
plot(predictors)
# reading species data
dsn <- system.file("external", package="usdm")
sp <- readOGR(dsn=dsn,layer="species_nl")
# quantifying the level of local spatial association given positional uncertainty:
spl<-speciesLisa(predictors,sp,uncertainty=15000,weights=c(0.14,0.2,0.38,0.28))
spl
# visualizing the level of lisa at species occurrence locations
plot(spl)
# reading boundary map
dsn <- system.file("external", package="usdm")
bnd <- readOGR(dsn=dsn,layer="boundary")
# including boundary in the map:
plot(spl,bnd)
Reference:
- Naimi, B. Hamm, N.A.S., Groen, T.A., Skidmore, A.K., Toxopeus, A. (2013) Where is positional uncertainty important for species distribution modelling? Ecography, DOI: 10.1111/j.1600-0587.2013.00205.x